Getting started
To get started using the Writeback Comments visual, please watch this video, or follow the steps below.
Step-by-step guide
If videos aren’t your thing, here’s a step-by-step guide to help you get started with the Writeback Comments visual.
1) Get the visual from AppSource or org.store
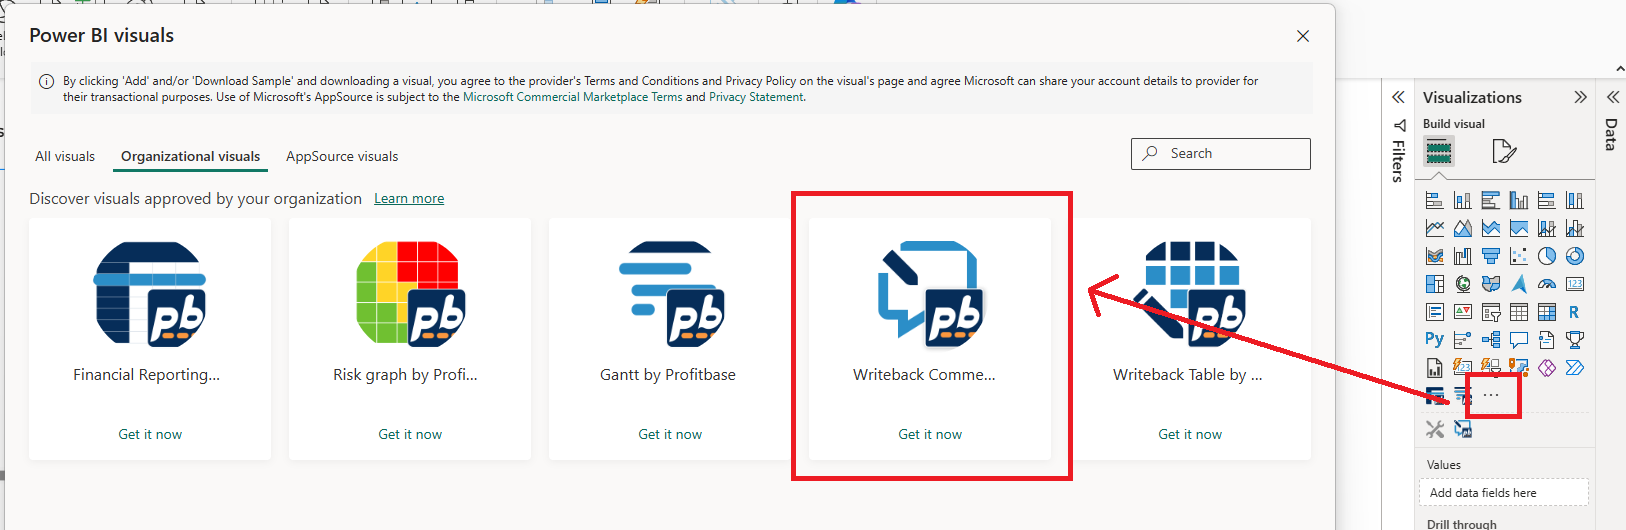
In PowerBI, go to the Visualizations panel and click Get more visuals.
Search for Writeback Comments by Profitbase in the popup, and add it to the toolbox.
2) Configure a data source using Direct Query
The Writeback Comments visual receives data from semantic models like any other Power BI visual. However, we stronly recommend the table for the Writeback Comments visual to use Direct Query instead of import mode. This is because, when data is written back to a database (e.g., Azure SQL), and import mode is used, users won’t see the changes until the semantic model is refreshed (which may minutes or hours, depending on your Power BI subscription). With DirectQuery, changes appear immediately.
Best practices for defining the writeback table
- The table where comments are stored must contain a column where the comments are stored. The 'comments' column can be named whatever you like, however naming it 'Comments' is good practice.
- The table where comments are stored must contain columns for the dimensionality that uniquely identifies a comment (row), for example DepartmentID and Period.
- If you are using Flow to handle the writeback, you do not need to pre-populate the comments table with all possible dimension combinations. Flow will automatically perform inserts, updates and deletes.
3) Add fields to the visual
Key columns
In the data panel, add at least one field to the Key columns well.
The fields in the Key columns well must be the unique key of the rows in the semantic model table. Editing in the visual is disabled when the selection applied by filters does not return a single row.
When saving comments, the values of the fields in the Key columns is sent to the backend and used to determine whether a comment should be inserted or updated (or deleted) in the commments table. If you are using Flow to handle the writeback, Flow will automatically determine whether to perform an update, insert or delete. You do not need to pre-populate the writeback table with data.
Comments column
In the data panel, add one field to the Comments well.
This must be the (text)field that contains the comments in the table.
When you press Save, this field will be updated in the data source.
4) Configure the backend (Writeback)
To save user comments, you must specify the API endpoint for the service that updates the data source. You have two options for doing this:
- Use Hypergene Flow with a Writeback Comments trigger and and Save DeltaSet action. This is the easiest option, and only takes a few minutes to set up. This is demonstrated in the video above.
- Create an Azure Function and implement the API for saving data to the data source yourself. If you choose this option, you will need a license for the visual.
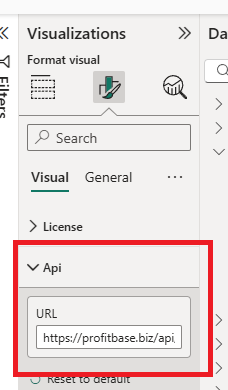
When you have created the backend, paste the endpoint address into the API Url setting in the Formatting panel.
5) Add a title (Optional, but recommended)
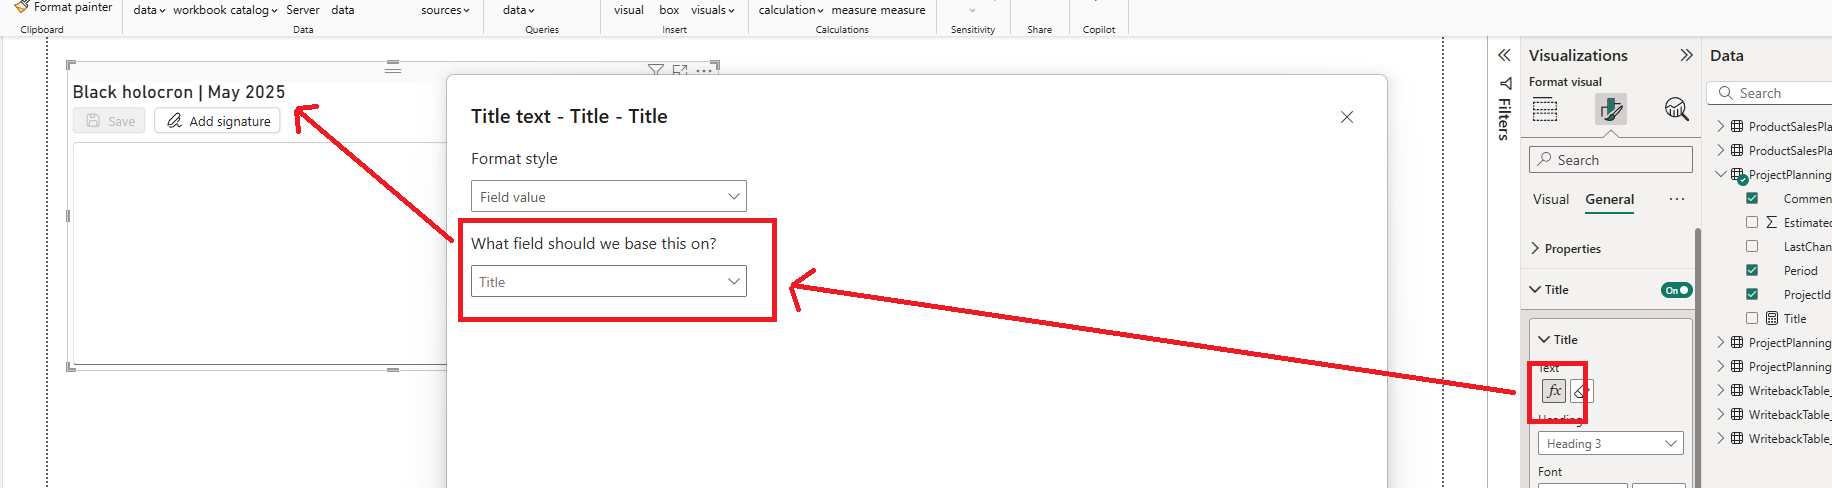
To make it easier for users to understand what they are commenting on, add a title to the visual that displays the selection.
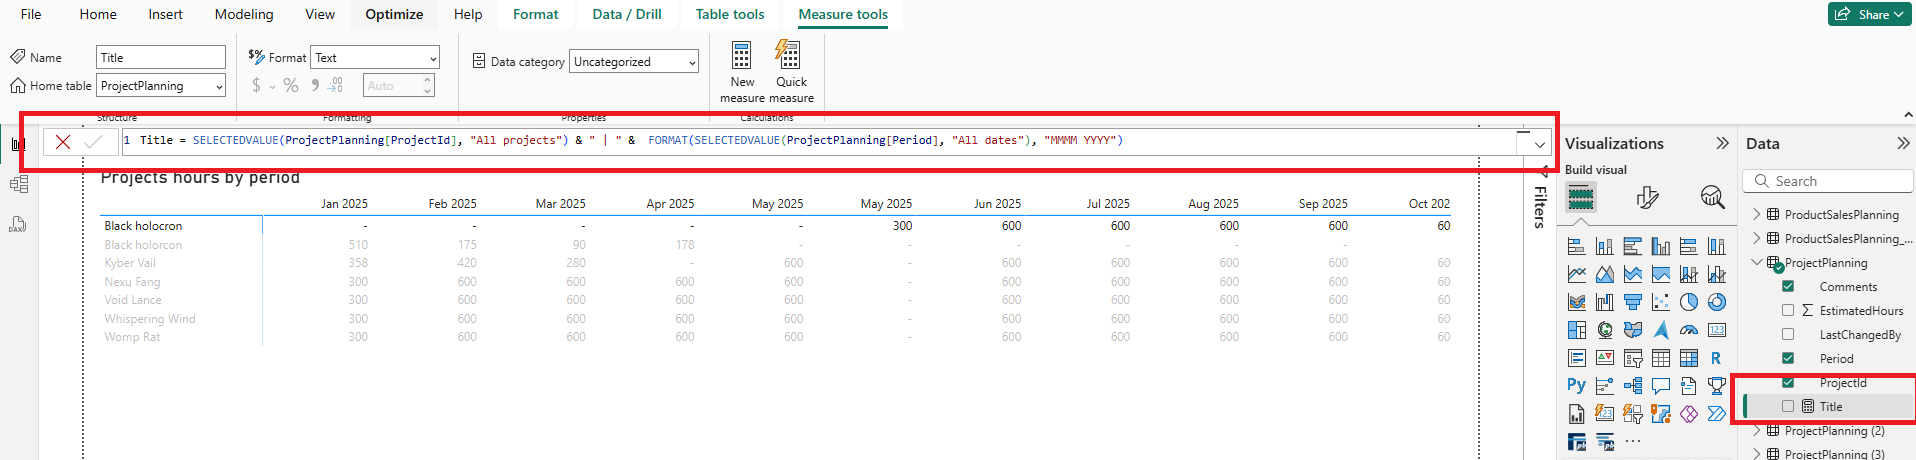
A simple way to do this, is to add a custom measure to the semantic model table (for example called 'Title'), and use a DAX expression to define the contents, for example
Title = SELECTEDVALUE(ProjectPlanning[ProjectId], "All projects") & " | " & FORMAT(SELECTEDVALUE(ProjectPlanning[Period], "All dates"), "MMMM YYYY")
Then, select the Title field in Formatting panel -> General -> Title