Details
Overview
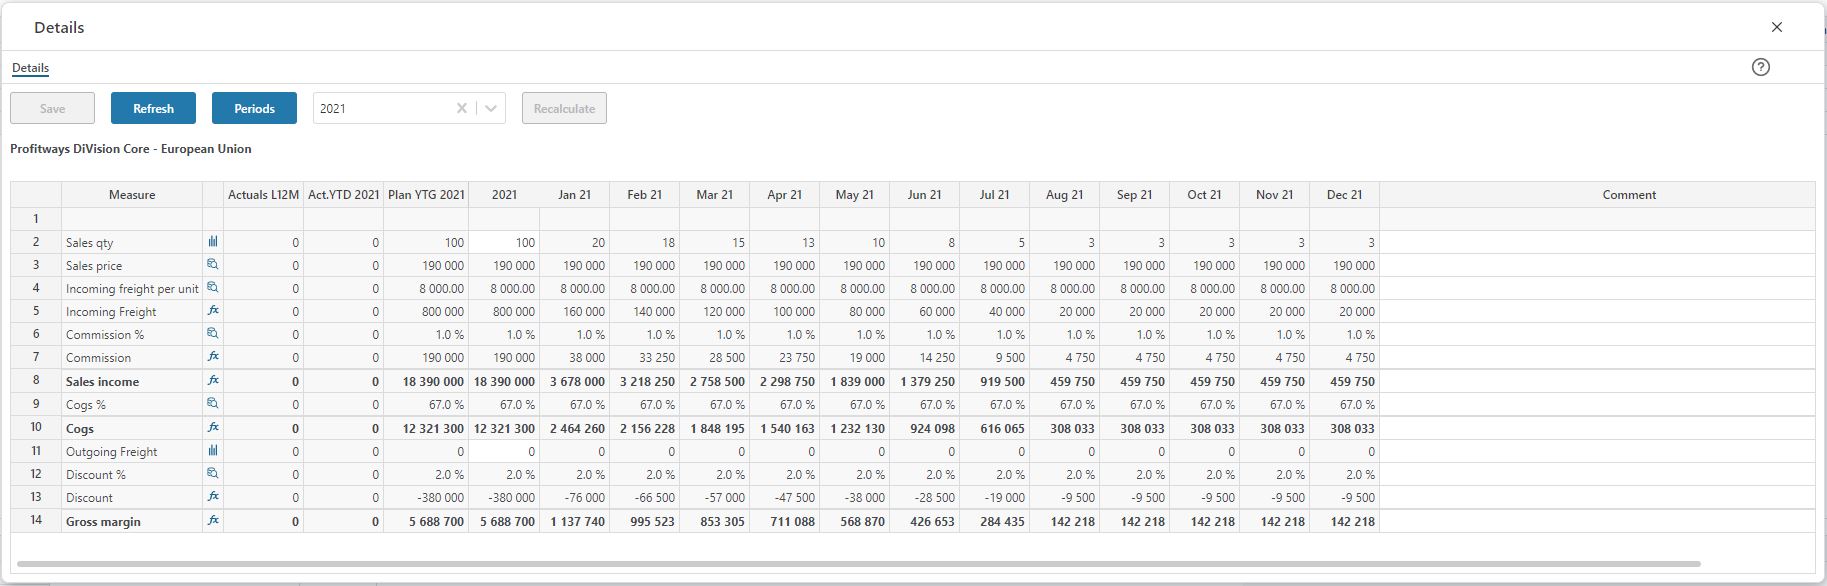
This is the the driver based detail view in which the complete model for a given dimensionality (dimensionality subject to configuration) can be viewed and adjusted.
- Periods button
The Periods button toggles the input mode between a year-total input and a periodic input. Any year-total input will automatically be distributed to the periods. Input made to periods will automatically be summed to the year-total. Note that the current year (this year) will consist of a set of actual periods that are read only and a set of plan periods that are editable. The cut off between actuals and plan is visualized with a red vertical line as show in the example. - Year filter
The year filter allows you to select the year to plan for. Note that the years available will vary from this year and next year (default) to an additional 5 years beyond next year depending on the solution configuration.
Column Descriptions
- Measure
The measure is the identifier of each individual model-row.
As this is the details view, all measures associated with the current model are displayed.
- Function column
The function column contains icons depending on the nature of the measure:
(TODO)
- Actuals L12M
The last 12 month actuals.
- Act. YTD (2021 in the example)
The actuals year-to-date, visible only if the year selected is this year.
- For. YTG (2021 in this case)
The forecast for the plan periods for the rest of the year (YTG - Year To Go), visible only if the year selected is this year.
- Year (2021 in this case)
The year-total for the year selected.
Note that some measures are defined as summable over periods and will thus render the sum of the periods whereas other measures may be defined to average over periods and will thus render the arithmetic average.
From Planner version 5.3 onwards, you can right-click an input cell and select Validate financial simulation to see the financial impact of the input value. Note that this value is first distributed across one or more periods resulting in multiple source rows for the financial simulation. The results is presented in a separate pop-up window.
- Periods (Jan 21 - Dec 21 in this case)
The individual periods.
Note that some measure are defined as input measures and thus be editable while others may be lookups to central assumptions and calculations and thus not be editable.
The Periods button toggles the mode of any editable measure between editing the year-total and the individual periods.
- Comment
Input field enabling textual comments to be associated with the input for a specific line.