Setup report
Applies to: ![]() Planner 4.x, 5.0 and 5.1
Planner 4.x, 5.0 and 5.1
Overview
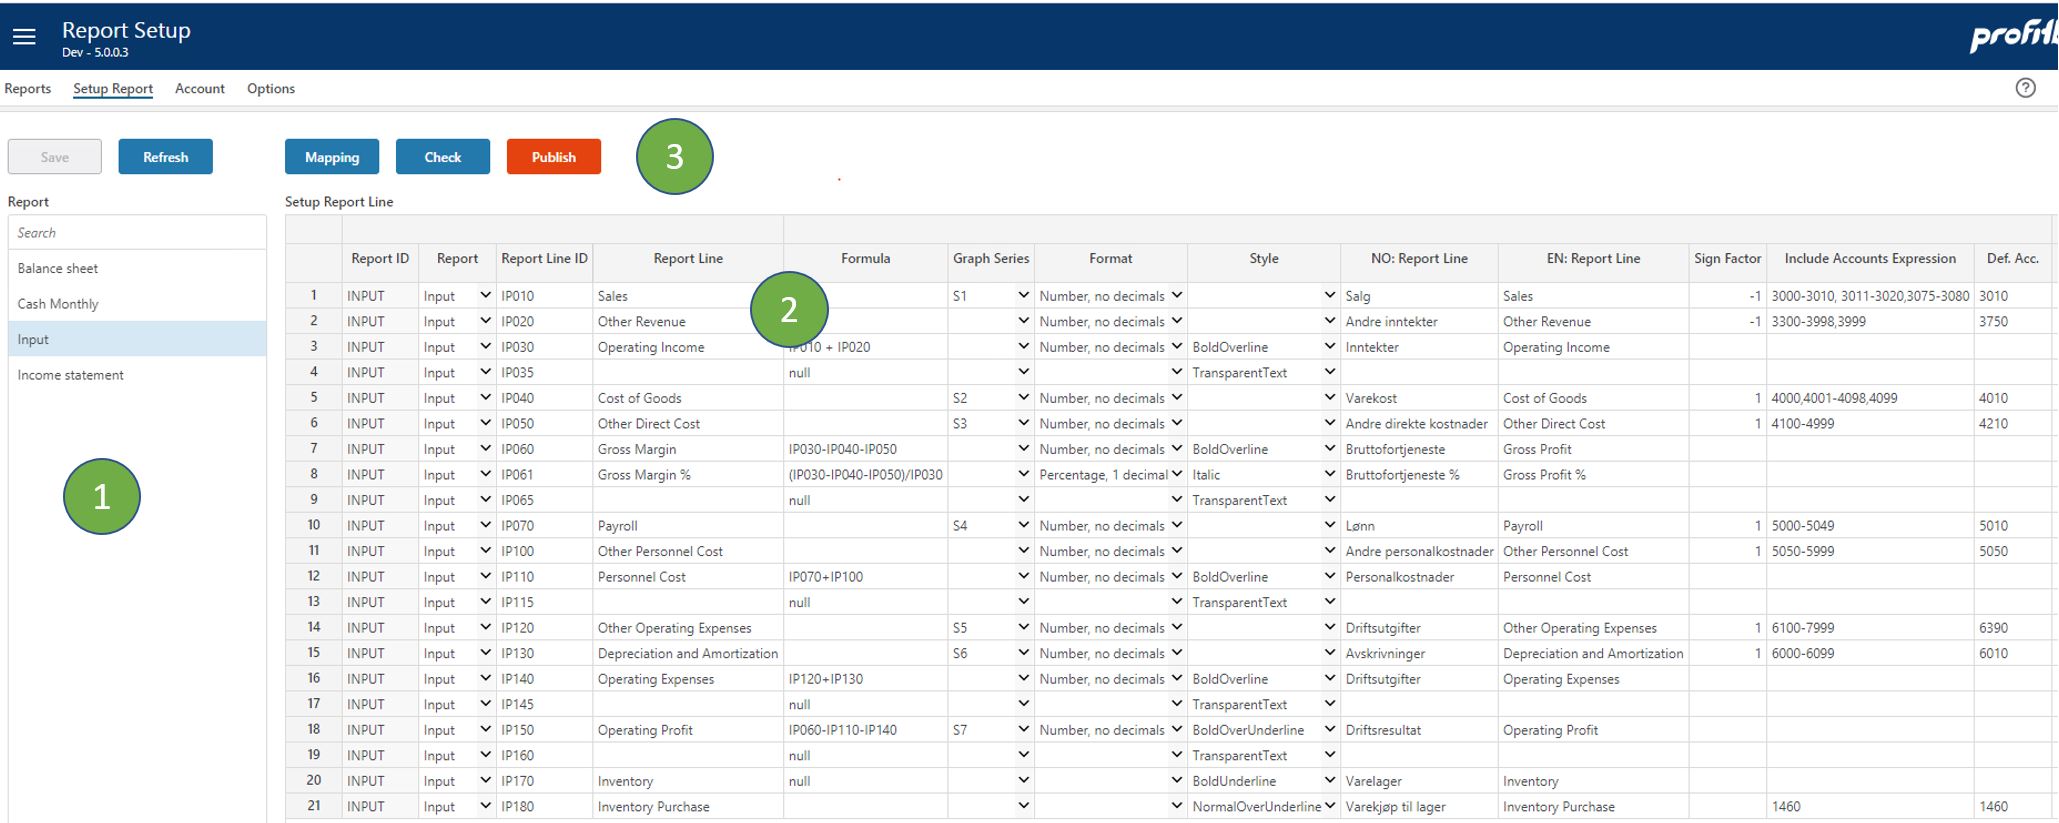
This is to create and edit the report lines for each report, including styling and formulas for sub-totals.
The important things that can be done here are:
- Create an ID for the report line. Best practice here is to use a prefix from the report id and then a fixed length string that sorts as you want the rows to appear in the report. Please ensure to keep gaps in the sequence to allow for inserts at a later stage. Keep IDs short to avoid formula expressions to become unreadable.
- Insert rows for subtotals and define formulas as arithmetic operations (+-*/) using the row IDs.
- Select which rows should have graph series.
- Select the format to be used for the numbers on the row.
- Select the style for the row
- Define the English and Norwegian translation for the rows.
- Define the sign factor for the row. This is to tell how to present numbers as positive or negative considering that numbers are aggregated from account values with positive or negative representation. Sales for example is normally booked as negative number but you may want to present sales income as a positive number. In this case you use -1.0 as Sign Factor. Default sign factor is 1.0.
- Account mapping is defined as intervals and individual accounts. 1000-1999 defines an interval of all account from 1000 to 1999 inclusive. 3030,3015,3020 is the list of the 3 accounts listed. These two representations can be combined into a mapping string separated by comma (,).
- Report
Select report here - Setup Report Line
Define the report lines for the report. - Button Row
Apart from the normal Save and Refresh buttons there are a few more:- Mapping
Click this button to inspect individual accounts mapped to each report line. - Check
Click this button to run a check across all reports to identify overlaps. Overlaps is when the same account is mapped to more than one line in the same report. Overlap is often wrong but not always. - Publish
Click this button to apply changes to report definitions. This will use the report account mapping to prepare data for reporting for the new or changed report.
- Mapping
Right-click mouse to insert a new row for new report.
Column Descriptions
- Report ID (k)
ID text string to uniquely identify the report. Read-only field that is set when selecting report in the next column. - Report
Dropdown to select report by name. Mandatory. - Report Line ID
ID text string to uniquely identify the report line. Recommended naming convention is to use a prefix that identifies the report followed by the part to identify the line. All IDs should have the same length and the IDs determine the sorting sequence of the report lines. Note that the example above allows for inserting lines between the IDs without extending or changing the names of other report lines. - Report Line
Descriptive text for the report line. - Formula
For subtotal or other calculated report lines, type the arithmetic expression containing report line IDs and operations (+, -, *, /, (...)). - Graph Series
Dropdown to select which report lines that can be displayed as a trendline in the trend reports. - Format
Dropdown to select how to format the numbers in the report. - Style
Dropdown to select how to style the row. - NO: Report Line
Line name translation in Norwegian. Optional. - EN: Report Line
Line name translation in English. Optional. - Sign Factor
Set this factor normally to -1.0 or 1.0 to change sign on report line. Sign factor is relevant in two scenarios:
- Account sign factor (see Account). A sign factor of -1 tied to an account will:
o Switch the sign of any historical data
o Switch the sign of any input data
This would typically apply to income accounts booked with a credit sign that one would like to see and input as a positive amount in an input form. - Report line sign factor (this field): a report line nets a range of accounts or is a calculation of other report lines.
The report line sign factor indicates whether this net amount should be presented "as is" (sign factor +1) or with the opposite sign (sign factor -1) in this particular report.
Note that any report lines that act as calculations of other report lines will perform that calculation based on the values displayed, i.e. after the sign factor has been applied. The sign factor will not change the sign of a calculation formula.
- Account sign factor (see Account). A sign factor of -1 tied to an account will:
- IncludeAccountsExp
Set this account mapping to determine which account to be aggregated to this reporting line. Expression can be intervals: Start and end accounts separated by dash ("-") and single accounts separated by comma (","). For example 3000-31999,3200,3210,3500-3599. - Def. Acc. (from Planner 5)
Default account. This is the default account which allows one account to represent the report line.
The following columns is for external reporting tools and is not used by Profitbase Planner:
- Report Style
Dropdown list to set style for external report rendering. - Back Color
Hexadecimal code to set the background color. - Sorting
Text string to control sorting. - Report Formula
Formula syntax that can be consumed by eternal tool. The logic in the formula is the same as in the Formula column. By default the formula set in Formula column is copied to this column. Clicking on the formula, you can edit the formula and "Edited Preserve" is set to protect the edited formula from overwriting. - Edited Preserve
Set to True to protect the formula from being overwrite when the previous Formula column is changed.