Trend
Overview
This page enables graphical trending of the individual report lines in the Profit & Loss report.
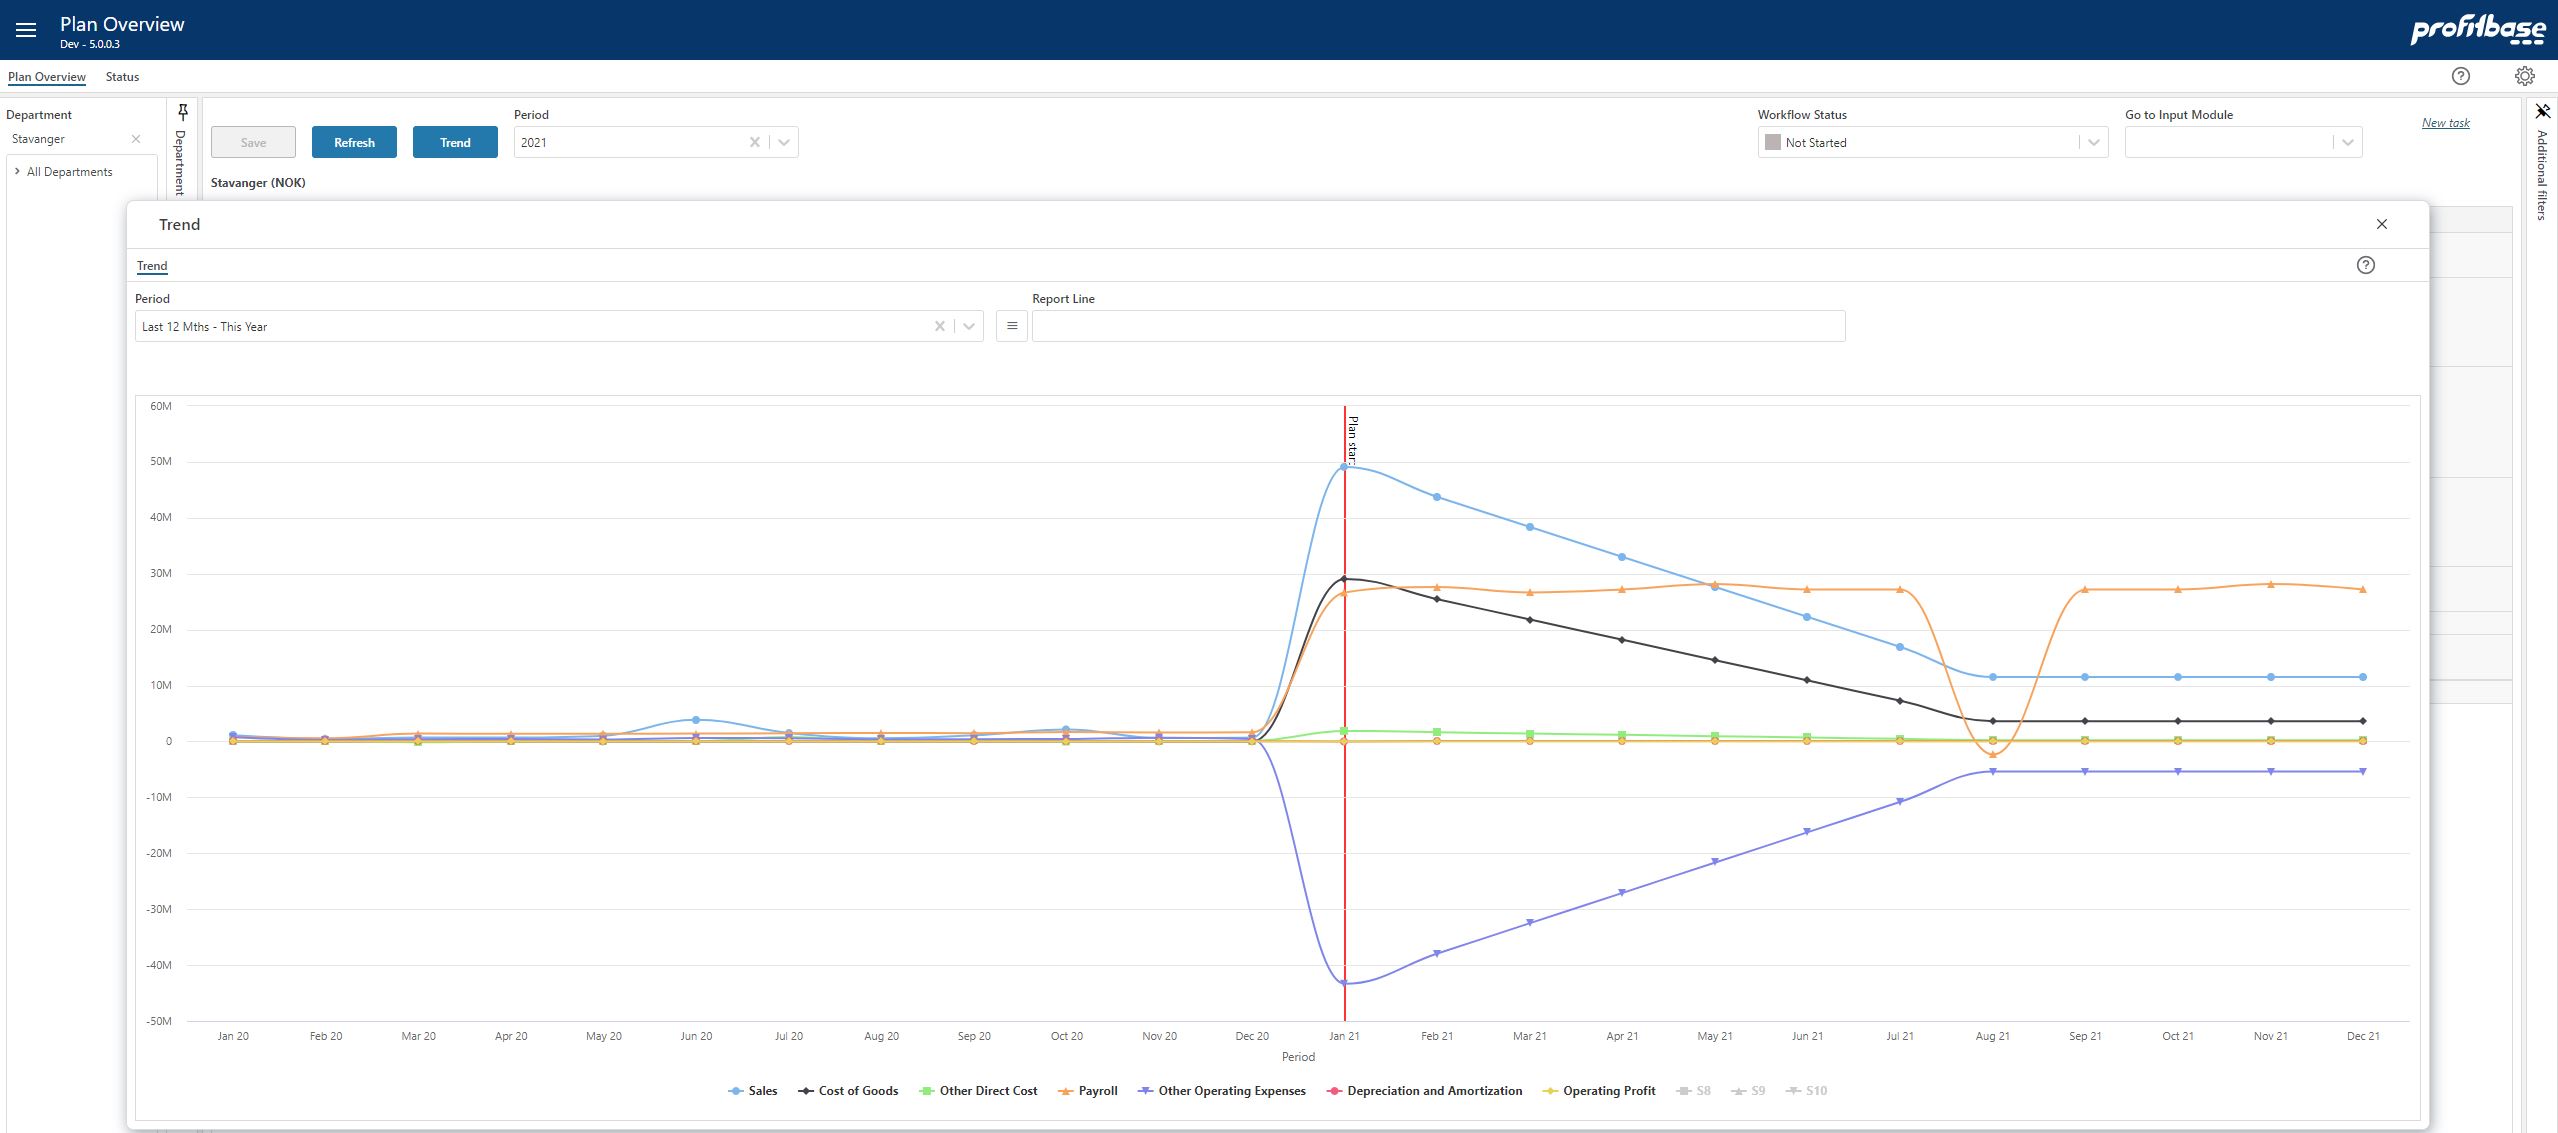
- Period filter
Select the period to trend. The following options are available:
- Last 12 Mths - This Year (default) - displays data for last 12 months (actuals) and forecast data up until the end of this year.
- Last 12 Mths - Next Year - displays data for last 12 months (actuals) and forecast data up until the end of next year.
- Last 12 Mths - Next 12 Mths - displays data for last 12 months (actuals) and forecast data for the next 12 months.
- Last 12 Mths - Next 24 Mths - displays data for last 12 months (actuals) and forecast data for the next 24 months.
In doing so, a historical set of trends will also be displayed.
- Report Line filter
Subject to configuration, a number of report lines are available for trending. By default, trends for all available report lines are displayed.
Click the filter button to the left of the filter box to select and/or deselect report lines. This filter allows multi select, i.e. one or more report lines can be selected. - The trend area. It will update based on the filter selections made.
Text