Drivers
Overview
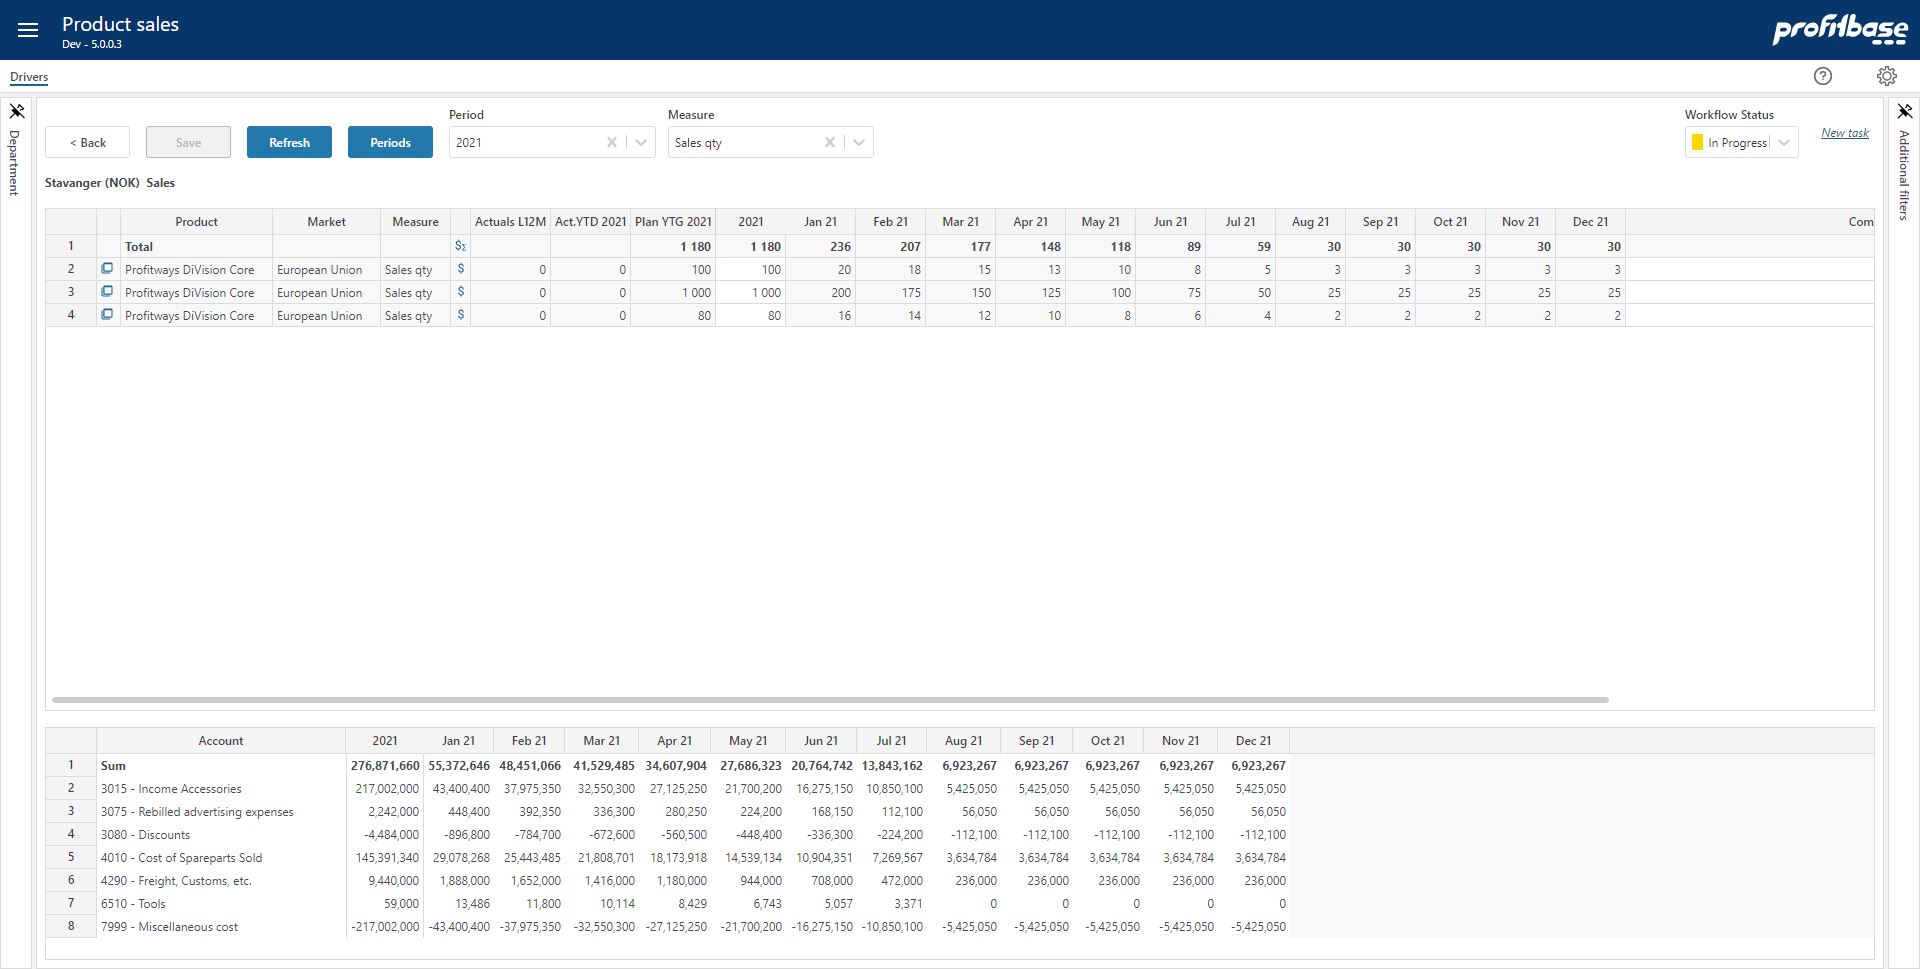
This is the drivers view in which the driver(s) can be adjusted and the financial effect of doing so can be viewed.
- Back button
This button is active when the module is launched from the Plan overview workbook. Clicking the Back button will launch the Plan overview workbook in the same browser window. If there are unsaved changes made in the driver based module, a prompt will appear requesting confirmation. - Periods button
The Periods button toggles the input mode between a year-total input and a periodic input. Any year-total input will automatically be distributed to the periods. Input made to periods will automatically be summed to the year-total. Note that the current year (this year) will consist of a set of actual periods that are read only and a set of plan periods that are editable. The cut off between actuals and plan is visualized with a red vertical line. - Year filter
The year filter allows you to select the year to plan for. Note that the years available will vary from this year and next year (default) to an additional 5 years beyond next year depending on the solution configuration. - Measure filter
The measure filter allows you to select the measure to input data for. All models will have at least one driver measure, most typically one driver measure. - Go to detail pop-up icon
The pop-up icon in the leftmost column takes you to the details of the current driver row. - Workflow
The workflow enables you to set the state of the plan for the department selected. Setting the state to Finished will by default disable any further input (depends on user's access level). - Attachment button
The attachment button will display the number of attachments associated with this input page in the current filter context. The current filter context is the selection made in the organizational filter (leftmost section) and the optional filters that are found in the rightmost section (subject to configuration).
To add a new attachment, click the attachment button and drag-then-drop the attachment from the file system onto the drop zone in the attachment dialogue.
To delete an attachment, click the attachment button, select the attachment and the click the Delete button (bin icon) within the attachment dialogue
- Account report
The account report display the financial effect of the input made and is updated as input data is saved. Note that for planning, the current year (this year) will consist of a set of actual periods that are read only and a set of plan periods that are editable. The cut off between actuals and plan is visualized with a red vertical line.
- Filters section(s) left and right
In the left section, the mandatory Department filter is displayed. The content of this filter is normally access controlled. In the right section, additional context filters (Product, Market, Activity, Project, depending on the solution configuration) are displayed. Make filter selections to narrow down the data displayed. From Planner 5.3 onwards, a Net filters check box is available that allows you to narrow down the filter member to those available in the data grid.
Column Descriptions
- Go to detail pop-up icon
The column contains a pop-up icon that, when clicked, takes you to the detailed model for the current driver row.
- Product, Market and/or possibly other dimensions depending on the configuration
The main planning dimensions for driver based related planning are most commonly Product and Market. These act as categories for the plan.
Note that the heading of the individual dimensions may be set individually per model and may thus differ from the example.
Right-click and select one of the "Insert new row.." options to add new rows.
- Measure
The measure is the identifier of each individual model-row.
In the drivers view, the measure will always be one of the driving measures.
- Financial report - "$" icon
The Financial report icon will trigger the reports for the row clicked. Clicking the icon for the sum row, will trigger the reports for all rows.
- Actuals L12M
The last 12 month actuals.
- Act. YTD (2021 in the example)
The actuals year-to-date, visible only if the year selected is this year.
- For. YTG (2021 in this case)
The total for the plan periods for the rest of the year (YTG - Year To Go), visible only if the year selected is this year.
- Year (2021 in this case)
The year-total for the year selected.
Note that some measures are defined as summable over periods and will thus render the sum of the periods whereas other measures may be defined to average over periods and will thus render the arithmetic average.
From Planner version 5.3 onwards, you can right-click an input cell and select Validate financial simulation to see the financial impact of the input value. Note that this value is first distributed across one or more periods resulting in multiple source rows for the financial simulation. The results is presented in a separate pop-up window.
- Periods (Jan 21 - Dec 21 in this case)
The individual periods.
Note that some measure are defined as input measures and thus be editable while others may be lookups to central assumptions and calculations and thus not be editable.
The Periods button toggles the mode of any editable measure between editing the year-total and the individual periods.
- Comment
Input field enabling textual comments to be associated with the input for a specific line.