Cash - Planner 4
Applies to: ![]() Planner 4
Planner 4
Overview
This report gives an insight to the cash simulation and is hence only applicable for Forecast and Budget datasets. 3 charts are used to show different degree of detail for cash development from simulating based on input on operation, loan, investments.
To use this report:
- Make selections and click Refresh-button to draw the report.
- Click on the legends below each graph section to toggle on/off individual graph objects.
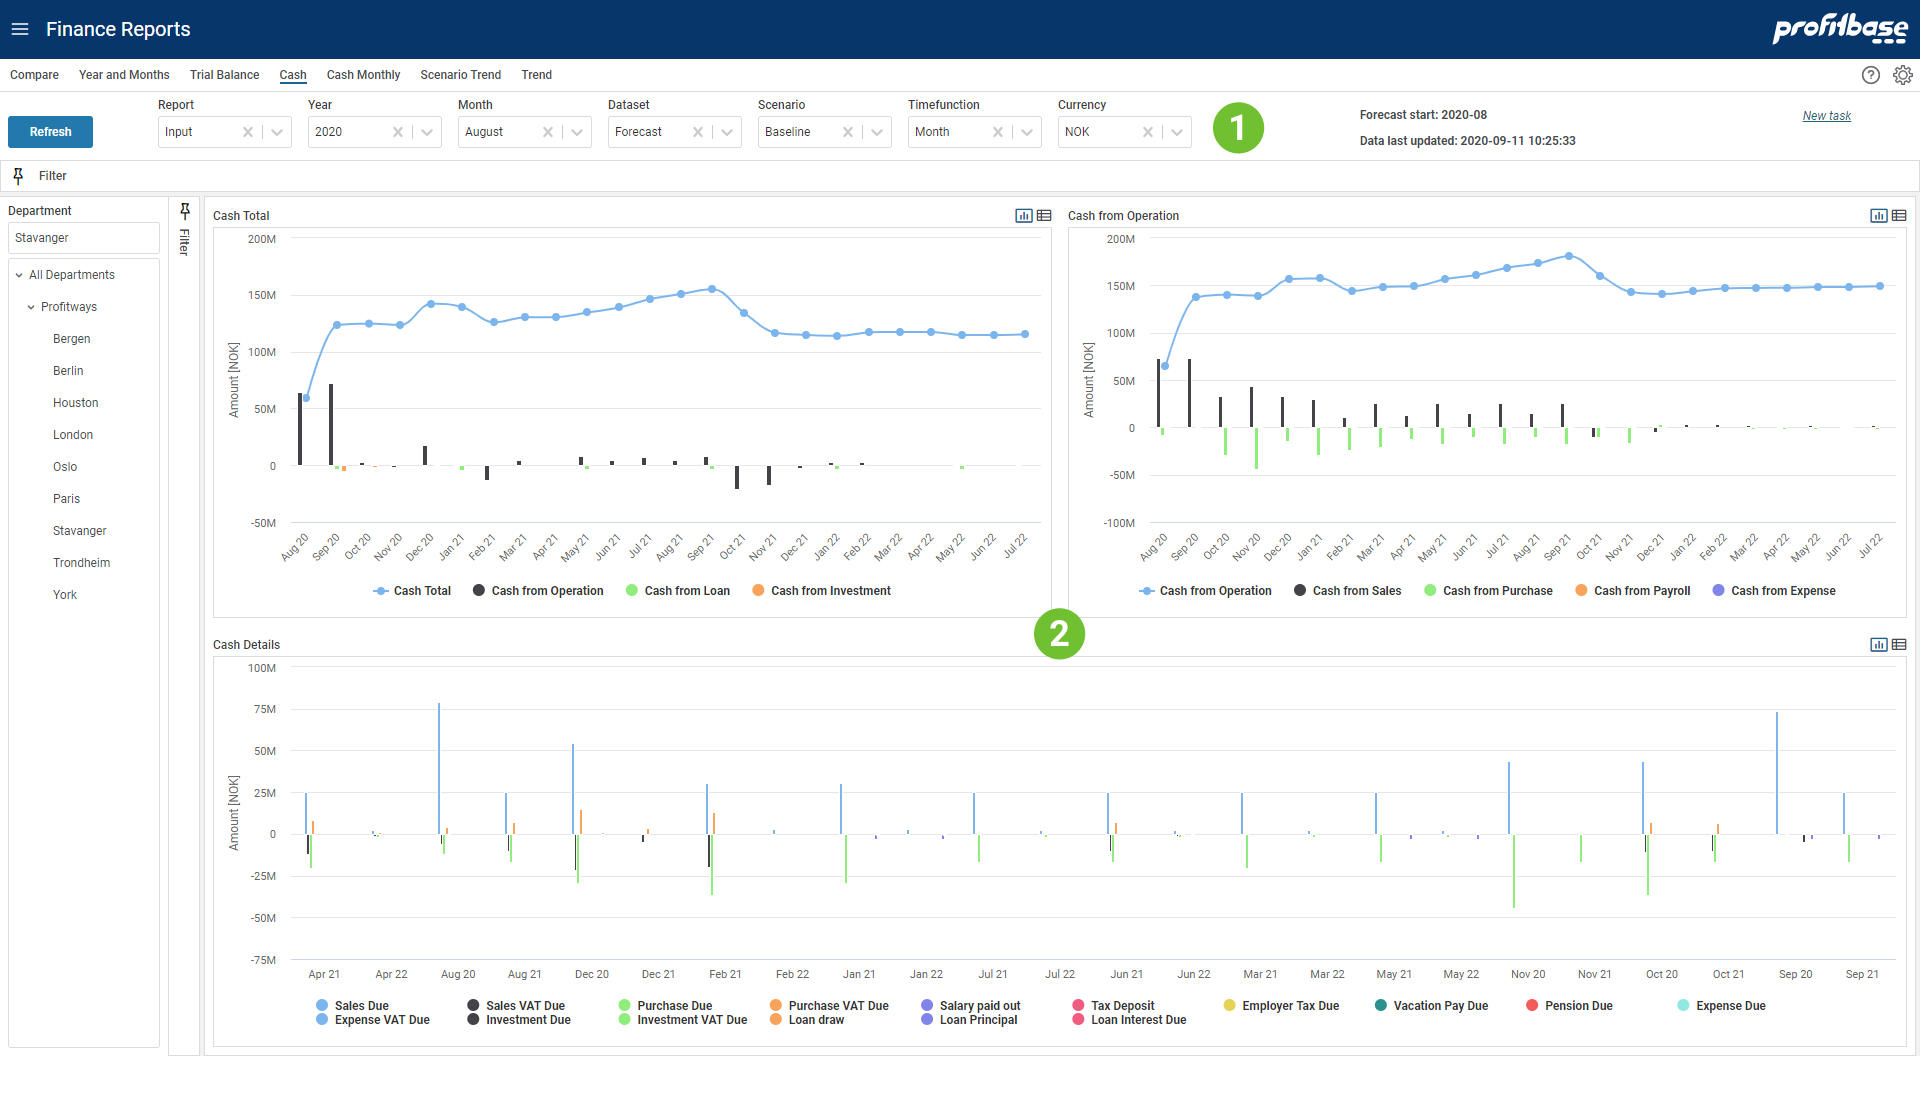
Top and Left Section
The left section contains the Department filter and gives the ability to slice data according to an organization hierarchy. The top sections contain mainly filter choices including selection of which report to presented. The upper right "Forecast start" tells which calendar period the forecast start. Since this may be a rolling forecast this period will be updated as the forecast reach next period. "Data last updated" tells when the input was last simulated to generate the full ledger. This process is normally scheduled to run at certain intervals.Content Section
The content is here presented using 3 charts:
- Cash Total - is showing the total cash from opening balance, total contribution from operation and financing activity (i.e. loans and investments).
- Cash from Operation - is showing cash contribution from operating activities
- Cash Detail - is showing details for cash in and out
The Forecast dataset is input data only from the Forecast start period (as shown in the upper right in the report).
Filter Descriptions
Filter selections available apart from Department are:
- Report
Not relevant here. - Year
Select start year to look at data. - Month
Select start month to look at data - Dataset
Select a dataset that is a result from processing/simulation. Normally this would be Forecast or Budget. - Scenario
Select scenario for selected dataset. - Timefunction
Not relevant here. - Currency
Choose which currency to the used in the report. Average rate for each period is used for currency conversion.
Graph Descriptions
- Cash Total:
This shows the total cash from opening balance, contribution from operation and financing activity (i.e. loans and investments). - Cash from Operation:
This shows cash contribution from operating activities such as sales, purchase, payroll and expenses. - Cash Details:
This shows details for cash in and out such as vacation pay, VAT due, salary pay, etc.
For all these there are a "total cash" line that is sum of all bars. One exception to this is the Cash Total which also contains the opening balance. For Forecast dataset, the cash total line contains the aggregated cash from Actual dataset for periods before the forecast start period. All other lines and contributions are from simulations for Forecast and Budget datasets. In general, for Actual data there will not be sufficient details from the General Ledger to show cash to this level of detail.