Year and Months
Applies to: ![]() Planner 5 or later.
Planner 5 or later.
Overview
This report provides a period view for selected Report showing all periods of the selected year. For Profit & Loss type of reports, a total sum over periods for the year is provided. For Balance Sheet type reports, an Opening Balance (OB) and Closing Balance (CB) or Total sum over periods are provided depending on Timefunction selection (see details below).
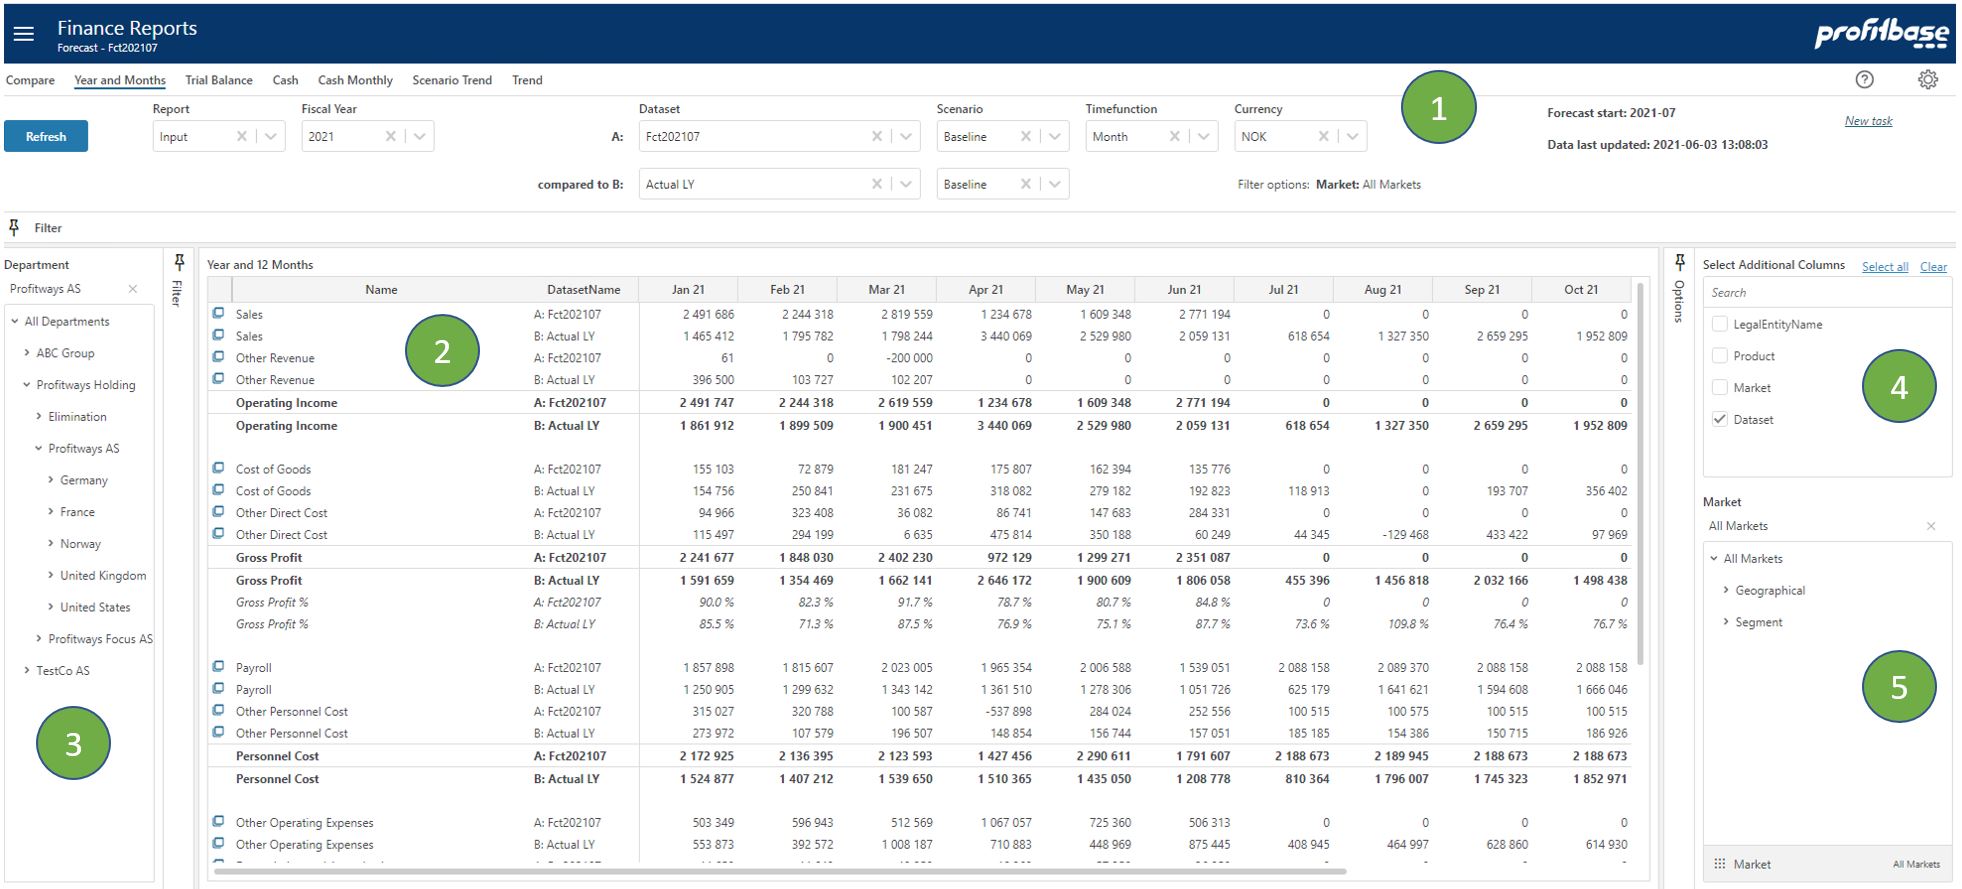
See an example of this report in picture below.
You can select additional columns to be included to compare data for example between dataset versions.
It is also possible to apply additional filters to "slice" data using other dimensions.
Options to add additional columns and filter data is controlled through configuration setup under Report Setup Options workbook page.
Top Section
The top section contains mainly filter choices including selection of which report to presented. The upper right "Forecast start" tells which calendar period the forecast start. Since this may be a rolling forecast this period will be updated as the forecast reach next period. "Data last updated" tells when the input was last simulated to generate the full ledger. This process is normally scheduled to run at certain intervals.Content Section
The content section shows the reporting lines including sub-totals per period for a selected year. The Forecast dataset is composed of Actual data for periods before the Forecast start and Forecast input data from the Forecast start period (as shown in the upper right in the report).Left Section
The left section contains the Department filter and gives the ability to slice data according to an organization hierarchy.Right Section - Upper
Click on "Options" on the right edge of the window, you can select additional columns to be included after the report line name column in the table report (section 2). The picture above shows an example using dataset to compare between a forecast dataset and actual last year. Additional columns enabled here is subject to configuration settings.Right Section - Lower
Click on "Options" on the right edge of the window, at the bottom you can select and additional filters to be applied when extracting data. You can see filters and values applied on the top section next to the label "Filter options:". Filters available here is subject to configuration settings.
Filter Descriptions
Filter selections available apart from Department are:
- Report
This allows for selecting between different report configurations - Fiscal Year
Select what year to look at - Dataset A
Select dataset to be presented. - compared to B
Optional select a dataset to be used for comparison together with selecting "Dataset" column under options. - Scenario
This is used related to simulation providing the alternatives: "Baseline", "Best" and "Worst". Scenario is only relevant for Forecast and Budget datasets. - Timefunction
Selecting Month will show the numbers for each month. Selecting Year-to-date will show the sum of this and preceding periods including OB for balance type reports. To see balanced you must use Year-to-date. - Currency
Choose which currency to the used in the report. Average rate for each period is used for currency conversion.
Column Descriptions
The number columns explained:
- MMM YY
These 12 columns contain numbers from the selected dataset and will show period values (when Timefunction = Month) and balance / year-to-date values (when Timefunction = Year-to-date). - Total
Provides the sum of period values over the above 12 columns for Profit-Loss type reports. For Balance type reports showing opening balance (OB) and period values (when Timefunction = Month), Total column is the sum on OB and period values. - OB
This is the Opening Balance and is only visible for Balance Sheet type reports. - CB
This is the Closing Balance and is only visible for Balance Sheet type reports when Timefunction = Year-to-date. CB is the sum of OB for plan start and the following plan columns when Timefunction = Year-to-date. When Timefunction = Month, CB is the sum of OB and the 12 period values (not including plan start OB). This is why CB may show different values for different sleection of Timefunction because plan OB is missing or adjusted (and hence not equal to year-to-date actual periods before plan start period).
From Planner versions after 5.1.3, the column header is different (showing Total or CB) to reflect the way this column is calculated.
You can select additional columns under "Options". These will be dataset and other dimensions that may be used in the report. Available columns are subject to configuration settings for you solution.